- Home
- Missions
- Data
- Communications
- People
- The Earth Observer Newsletter
Recent Imagery
You will be directed to the NASA Visible Earth webpage when you select Images by Mission below, or click on the images at right that are randomly generated to represent four out of all possible topics.

You are here
Booklets
NASA's Earth Observing System provides a variety of materials available for download. Feel free to choose a category below:
- Brochures
- Postcards
- Posters
- Science Writers’ Guide
- Mission Brochures
- Fact Sheets
- Calendars
- Booklets
- Lithographs
- Reference and Data Products Handbooks
- iBooks
- Activities
 |
2018 Centennial Narratives Project Booklet The AGU Centennial Narratives Project is an opportunity for individuals to share their personal Earth and space science stories. To search the narratives archive, visit: archive.storycorps.org and search keyword NASA Or, visit: https://centennial.agu.org/earth-space-science-history/agu-narratives-library NASA was honored to be part of such a tremendous effort to amplify the accomplishments of science over the last 100 years. This publication appears in: |
 |
Science Resources (April 2018) This booklet contains weblinks to NASA science resources. This publication appears in: |
 |
NASA's Science Communication Support Office Annual Report 2017 The Science Communications Support Office (SCSO) supported 18 domestic and international science conferences and 6 public events in 2017. The SCSO continues to provide an inspiring and interactive venue for every event during the year, using a unique storytelling approach that allows a variety of audiences worldwide to connect with NASA Science. The 2017 Annual Report provides an overview of these activities with details about new Hyperwall stories, publications, social media, key partnerships, and more! This publication appears in: |
 |
NASA Hyperwall Science Stories This brochure represents some of the science stories available on NASA’s Hyperwall. This publication appears in: |
 |
NASA Science Program Support Office Annual Report 2016 The Science Program Support Office (SPSO) supported 25 domestic and international science conferences and public events in FY2016. The SPSO strives to provide an inspiring and interactive venue for every event during the year, using a unique storytelling approach that allows a variety of audiences worldwide to connect with NASA Science. The 2016 Annual Report provides a broad overview of these activities, along with details about new Hyperwall stories, publications, social media, key partnerships, and more! This publication appears in: |
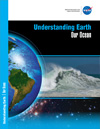 |
Understanding Earth: Our Ocean Viewed from space, Earth appears as a blue marble, as approximately 70% of Earth’s surface is covered by ocean water. The vast ocean holds roughly 97% of the planet’s water and represents 99% of the living space on Earth. NASA has been observing Earth’s ocean from space for more than 38 years, beginning with the launch of the first civilian oceanographic satellite, Seasat, on January 28, 1978. This brochure explains how NASA has the ability to observe and detect changes in the ocean (and on Earth as a whole) on a variety of spatial and temporal scales—ultimately positioning the Agency to improve life on our planet. This is related to the following mission(s):
This publication appears in:
|
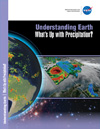 |
Understanding Earth: What's Up with Precipitation? Precipitation is any product of the condensation of atmospheric water vapor that falls quickly from a cloud. The main forms of precipitation include drizzle, rain, sleet, snow, grapple (soft hail or snow pellets), and hail. Today, scientists can measure precipitation directly—using ground-based instruments such as rain gauges—or indirectly—using remote sensing techniques (e.g., from radar systems, aircraft, and Earth-observing satellites). This brochure describes how satellite observations—often combined with other measurements taken on the ground or from aircraft—provide frequent estimates of precipitation at a global scale. Among other uses, precipitation datasets from NASA are used for forecasting tropical cyclones; monitoring soil moisture conditions and freshwater availability; and predicting flood and drought conditions, landslides, crop yields, and water-related illnesses. This is related to the following mission(s): This publication appears in: |
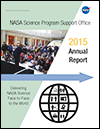 |
NASA Science Program Support Office Annual Report 2015 During FY2015, the Science Program Support Office (SPSO) supported 24 domestic and international science conferences and public events. Each year the SPSO strives to provide an inspiring and interactive venue, using a unique storytelling approach, that allows a variety of audiences worldwide to connect with NASA Science. The 2015 Annual Report provides a broad overview of these activities, along with details about new Hyperwall stories, publications, social media, key partnerships, and more! This publication appears in: |
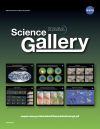 |
NASA Science Gallery The NASA Science Gallery reveals the “big picture” to help tell twelve fascinating stories about our changing planet. This publication appears in: |
 |
Understanding Earth: The Icy Arctic Over the last decade, satellite data—often combined with data from other sources—have revealed that the Arctic is changing at rates faster than anywhere else on Earth. These changes are interrelated and have both long- and short-term effects on Earth’s land surfaces, oceans, and atmosphere, ultimately impacting the Earth’s climate system. To better understand the Arctic environment, scientists at NASA are working in collaboration with various experts from other federal agencies, universities, private companies, and not-for-profit organizations. This booklet—the third in the Understanding Earth series—explains how NASA keeps a close eye on the Arctic and how the changes taking place there are affecting you. This publication appears in: |