
Recent Imagery
You will be directed to the NASA Visible Earth webpage when you select Images by Mission below, or click on the images at right that are randomly generated to represent four out of all possible topics.

You are here
iBooks
NASA's Earth Observing System provides a variety of materials available for download. Feel free to choose a category below:
- Brochures
- Postcards
- Posters
- Science Writers’ Guide
- Mission Brochures
- Fact Sheets
- Calendars
- Booklets
- Lithographs
- Reference and Data Products Handbooks
- iBooks
- Activities
 |
GRACE-FO Mission Brochure Changes in how mass is distributed within and between Earth’s atmosphere, oceans, groundwater and ice sheets are fundamental indicators of the large-scale dynamics of the planet. For more than 15 years, NASA’s Gravity Recovery and Climate Experiment (GRACE) mission monitored mass changes every month with far-reaching impact on our understanding of the Earth system and how it is evolving. GRACE Follow-On (GRACE-FO) continues the legacy of GRACE, tracking Earth’s water movement and surface mass changes across the planet. Monitoring changes in ice sheets and glaciers, near-surface and underground water storage, the amount of water in large lakes and rivers, as well as changes in sea level and ocean currents provides an integrated global view of how Earth’s water cycle and energy balance are evolving—measurements that have important applications for everyday life. This is related to the following mission(s): This publication appears in: |
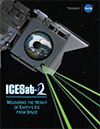 |
ICESat-2 Mission Brochure ICESat-2 will take measurements across the globe and provide an incredibly precise height map of our planet in unprecedented detail. Its focus will be on Earth’s poles, including the Arctic region where temperatures are rising faster than at other latitudes. Read more about how this innovative spacecraft will help scientists check on the health of Earth's frozen regions. This is related to the following mission(s):
This publication appears in:
|
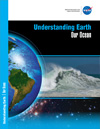 |
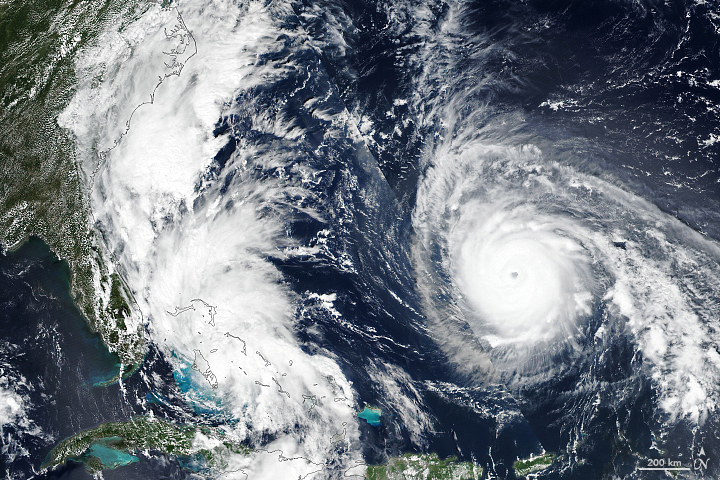
Understanding Earth: Our Ocean Viewed from space, Earth appears as a blue marble, as approximately 70% of Earth’s surface is covered by ocean water. The vast ocean holds roughly 97% of the planet’s water and represents 99% of the living space on Earth. NASA has been observing Earth’s ocean from space for more than 38 years, beginning with the launch of the first civilian oceanographic satellite, Seasat, on January 28, 1978. This brochure explains how NASA has the ability to observe and detect changes in the ocean (and on Earth as a whole) on a variety of spatial and temporal scales—ultimately positioning the Agency to improve life on our planet. This is related to the following mission(s):
This publication appears in:
|
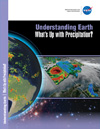 |
Understanding Earth: What's Up with Precipitation? Precipitation is any product of the condensation of atmospheric water vapor that falls quickly from a cloud. The main forms of precipitation include drizzle, rain, sleet, snow, grapple (soft hail or snow pellets), and hail. Today, scientists can measure precipitation directly—using ground-based instruments such as rain gauges—or indirectly—using remote sensing techniques (e.g., from radar systems, aircraft, and Earth-observing satellites). This brochure describes how satellite observations—often combined with other measurements taken on the ground or from aircraft—provide frequent estimates of precipitation at a global scale. Among other uses, precipitation datasets from NASA are used for forecasting tropical cyclones; monitoring soil moisture conditions and freshwater availability; and predicting flood and drought conditions, landslides, crop yields, and water-related illnesses. This is related to the following mission(s): This publication appears in: |
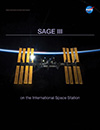 |
SAGE III on the International Space Station NASA’s Stratospheric Aerosol and Gas Experiment (SAGE) family of remote-sensing-satellite instruments has long measured ozone (O3) concentrations, stratospheric aerosols, water vapor, and other trace gases that influence Earth’s atmosphere. Planned for launch in 2016, SAGE III on the International Space Station will continue the legacy of accurate SAGE measurements. This brochure provides details about the instrument, launch and installation, ground system and data, and more! This publication appears in: |
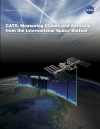 |
CATS: Measuring Clouds and Aerosols from the ISS In 2011 the International Space Station (ISS) NASA Research Office offered scientists at NASA’s Goddard Space Flight Center a mounting location onboard the space station for a new lidar instrument called the Clouds and Aerosol Transport System (CATS). Described in this brochure, CATS provides vertical profiles of cloud and aerosol properties at three wavelengths (1064, 532, and 355 nanometers). The CATS mission seeks to build on the CALIPSO data record, provide observational lidar data to improve research and operational modeling programs, and demonstrate new lidar retrievals of clouds and aerosols from space. These technologies and the science gained from the CATS mission will be used to design future missions that will study clouds and aerosols and their affects on Earth’s climate and air quality for years to come. This is related to the following mission(s): This publication appears in: |
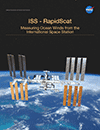 |
ISS-Rapid Scatterometer (2014) Described in this brochure, NASA’s International Space Station Rapid Scatterometer, or ISS-RapidScat, is the first scientific instrument specifically created to observe Earth winds from the space station. Scheduled for launch in late 2014, the experimental mission will measure ocean-surface wind speeds and directions, providing data that are needed to support weather and marine forecasting—including tracking storms and hurricanes—and climate research. The space station’s unique orbit will allow ISS-RapidScat to make the first direct observations of how ocean winds vary over the course of the day. This is related to the following mission(s): This publication appears in: |
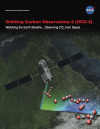 |
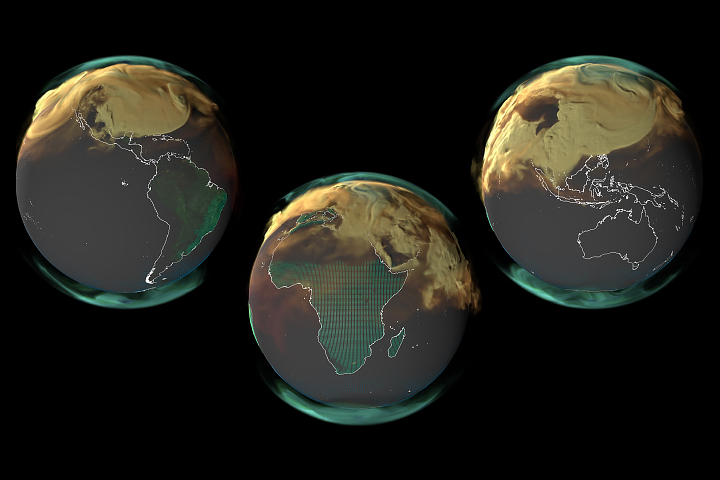
Orbiting Carbon Observatory 2 (2014) This brochure describes NASA's Orbiting Carbon Observatory 2 (OCO-2) mission. OCO-2 is the first NASA satellite dedicated to monitoring carbon dioxide, and it will do so with greater precision and detail than current instruments. Data from OCO-2 will help scientists understand where carbon dioxide is being emitted and removed from the atmosphere, subsequently allowing them to make projections of how Earth’s climate might respond to these changes in the future. This is related to the following mission(s): This publication appears in: |
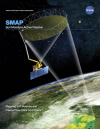 |
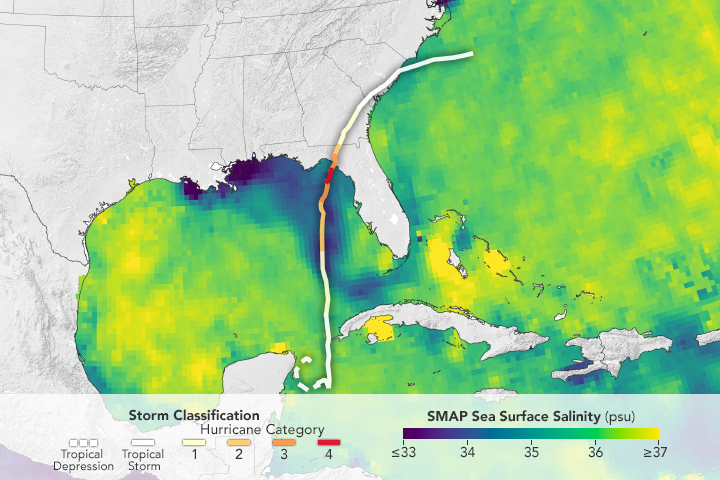
Soil Moisture Active Passive (2014) The Soil Moisture Active Passive, or SMAP, mission (described in this brochure) is NASA’s first Earth-observing satellite mission designed to collect continuous global observations of surface soil moisture and freeze/thaw state every 2-3 days at 3 to 40 kilometer (~2 to 25 mile) spatial resolution. As suggested by the name “Active Passive,” SMAP will carry an active microwave radar and a passive microwave radiometer that will measure across a 1000-kilometer (~621-mile) wide swath. The ability to measure global soil moisture and its freeze/thaw state from space with unprecedented accuracy and spatial resolution will allow scientists to better understand the processes that link the Earth’s water, energy, and carbon cycles, as well as enhance the predictive skills of weather and climate models. In addition, scientists can use these data to develop improved flood prediction and drought monitoring capabilities. Societal benefits include improved water-resource management, agricultural productivity, and wildfire and landslide predictions. This is related to the following mission(s): This publication appears in: |
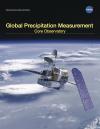 |
GPM Core Observatory (2014) The Global Precipitation Measurement (GPM) mission is an international partnership co-led by NASA and the Japan Aerospace Exploration Agency (JAXA). The mission centers on the deployment of the GPM Core Observatory and consists of a network, or constellation, of additional satellites that together will provide next-generation global observations of precipitation from space. In this brochure you will learn about the specifics of the GPM Core Observatory and its role in the GPM mission. This is related to the following mission(s): This publication appears in: |