
You are here
Postcards
NASA's Earth Observing System provides a variety of materials available for download. Feel free to choose a category below:
- Brochures
- Postcards
- Posters
- Science Writers’ Guide
- Mission Brochures
- Fact Sheets
- Calendars
- Booklets
- Lithographs
- Reference and Data Products Handbooks
- iBooks
- Activities
 |
NASA Science 12-inch Ruler NASA Science 12-inch Ruler This publication appears in: |
|
|
What's Binary Code? To process and store data, computers use a simple coding system, called binary code (“bi” means two). Like a simple light switch which has only two positions—ON and OFF—computers encode data using only two binary digits—0 and 1, called bits. All letters (see back), digits, and special characters have been encoded with defined sequences of bits. Most modern character-encoding schemes use a binary string of eight bits. This publication appears in: |
 |
NASA Earth Observations: Quick Tools Quick tools to explore Earth science concepts. This publication appears in: |
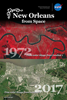 |
New Orleans from Space Postcard of New Orleans, LA. The top image is a 1972 false color Landsat 1 scene of New Orleans, LA that uses green, red, and infrared wavelengths to highlight vegetation in red. Advances in space imaging over the past four and a half decades allow sensors to record more wavelengths. Today, true color Landsat 8 scenes, such as the one shown in the bottom image, look like photographs from space. This is related to the following mission(s): This publication appears in: |
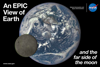 |
An EPIC View of Earth and the Far Side of the Moon On July 16, 2015, a NASA camera onboard the Deep Space Climate Observatory (DSCOVR) satellite returned a series of images of the entire sunlit side of Earth and the moon from its orbit at the first Lagrange point (L1)—a neutral gravity point between Earth and the sun, which is about 1 million miles (1.5 million kilometers) from Earth. These images from the series, taken by the Earth Polychromatic Imaging Camera (EPIC) between 3:50 PM and 8:45 PM EDT, show the fully illuminated far side of the moon moving over the Pacific Ocean near North America. Also referred to as the “dark side,” this side of the moon is not visible from Earth. The far side lacks the large, dark, basaltic plains, or maria, that are so prominent on the Earth-facing side. The largest far side maria is the Mare Moscoviense [~170 miles (245 kilometers) in diameter] in the upper left quadrant. As the DSCOVR spacecraft slowly orbits around L1 (always viewing the sunlit side of Earth), the area of reflected sunlight near the center of the globe remains stationary, while the moon crosses the face of the Earth’s surface and Earth appears to rotate from left (west) to right (east). The North Pole is in the upper left quadrant of the globe. The primary objective of DSCOVR—a partnership between NASA, the National Oceanic and Atmospheric Administration (NOAA), and the U.S. Air Force—is to maintain the nation’s real-time solar wind monitoring capabilities, which are critical to the accuracy and lead time of space weather alerts and forecasts from NOAA. This is related to the following mission(s): This publication appears in: |
|
|
Earth System Ruler Like the human body, Earth comprises diverse processes and systems that interact with one another in complex ways. The purpose of NASA’s Earth science program is to advance our scientific understanding of Earth as an integrated system and its response to natural and human-induced changes. NASA works with its domestic and international partners to support a large number of Earth-observing satellite and airborne missions to observe and understand our planet on global and regional scales. These missions are able to collect measurements of surface temperature, winds, water vapor, clouds, precipitation, soil moisture, ocean salinity, and other aspects of the environment. While scientists learn a great deal from studying individual phenomena, improved observational capabilities, coupled with process-level and global numerical models increasingly allow them to study component system interactions, leading to unprecedented insight into how Earth functions as one integrated system of systems. This publication appears in: |
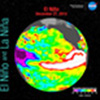 |
El Niño and La Niña This lenticular flip card shows El Niño (December 27, 2015), neutral (January 15, 2014), and La Niña (November 15, 1999) sea surface heights relative to a reference state established in 1992. In the equatorial region of the Pacific Ocean, the sea surface height during El Niño was higher by more than 18 cm over a large longitudinal region. This is related to the following mission(s): This publication appears in: |
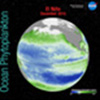 |
Ocean Phytoplankton, El Niño and La Niña This lenticular flip card shows monthly sea surface chlorophyll in the Pacific Ocean as observed during El Niño (December 2015), neutral (December 2013), and La Niña (December 1999) conditions. Due to warmer-than-normal sea surface temperatures, increased stratification, and a decrease in upwelled ocean nutrients, El Niño conditions in 2015 caused the local marine food web to experience loss of its usual food supply. This is related to the following mission(s): This publication appears in: |
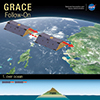 |
Sensing Gravity from Space: GRACE Follow-On The Gravity Recovery And Climate Experiment Follow-On (GRACE-FO) mission will map variations in Earth’s gravitational field. GRACE-FO is a successor to the original GRACE mission, which began orbiting Earth on March 17, 2002. Unlike other missions, the GRACE satellites together form the “instrument”: Two identical spacecraft, orbiting Earth at about 220 km (137 mi) apart, will constantly send signals to each other to measure and track how the distance between them changes as gravity pulls on each satellite. This lenticular card illustrates the movements of the satellites as they pass southward from the Caribbean Sea across Colombia and Peru (i.e., a denser landmass) to the Pacific Ocean. This is related to the following mission(s): This publication appears in: |
 |
GLOBE Program Bookmark The Global Learning and Observations to Benefit the Environment (GLOBE) Program connects students, teachers, scientists, and other citizens to learn about the Earth environment and climate through data collection, analysis, and research. These data are entered into an international scientific database via website or with apps, and shared for analysis and research by students and scientists from over 100 countries around the world. This publication appears in: |