
You are here
Mission Brochures
NASA's Earth Observing System provides a variety of materials available for download. Feel free to choose a category below:
- Brochures
- Postcards
- Posters
- Science Writers’ Guide
- Mission Brochures
- Fact Sheets
- Calendars
- Booklets
- Lithographs
- Reference and Data Products Handbooks
- iBooks
- Activities
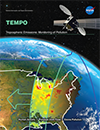 |
TEMPO Mission Brochure What's in the air we breathe? The TEMPO (Tropospheric Emissions: Monitoring Pollution) mission aims to answer this question with more detail and precision than ever before, by creating a revolutionary new dataset of atmospheric chemistry measurements from space. TEMPO will be the first space-based instrument to monitor major air pollutants across the North American continent every daylight hour at high spatial resolution. This publication appears in: |
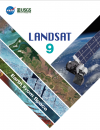 |
Landsat 9 Mission Brochure For nearly half a century, the Landsat mission has shaped our understanding of Earth. The consistency of Landsat’s land-cover data from sensor to sensor and year to year makes it possible to trace land-cover changes from 1972 to the present, and it will continue into the future with Landsat 9. With better technology than ever before, Landsat 9 will enhance and extend the data record to the 50-year mark and beyond. This is related to the following mission(s): This publication appears in: |
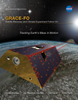 |
GRACE-FO Mission Brochure Changes in how mass is distributed within and between Earth’s atmosphere, oceans, groundwater and ice sheets are fundamental indicators of the large-scale dynamics of the planet. For more than 15 years, NASA’s Gravity Recovery and Climate Experiment (GRACE) mission monitored mass changes every month with far-reaching impact on our understanding of the Earth system and how it is evolving. GRACE Follow-On (GRACE-FO) continues the legacy of GRACE, tracking Earth’s water movement and surface mass changes across the planet. Monitoring changes in ice sheets and glaciers, near-surface and underground water storage, the amount of water in large lakes and rivers, as well as changes in sea level and ocean currents provides an integrated global view of how Earth’s water cycle and energy balance are evolving—measurements that have important applications for everyday life. This is related to the following mission(s): This publication appears in: |
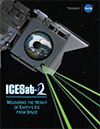 |
ICESat-2 Mission Brochure ICESat-2 will take measurements across the globe and provide an incredibly precise height map of our planet in unprecedented detail. Its focus will be on Earth’s poles, including the Arctic region where temperatures are rising faster than at other latitudes. Read more about how this innovative spacecraft will help scientists check on the health of Earth's frozen regions. This is related to the following mission(s):
This publication appears in:
|
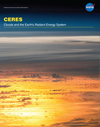 |
CERES FM6 The Clouds and the Earth’s Radiant Energy System, or CERES, instrument measures reflected sunlight and thermal radiation emitted by the Earth. Data products from CERES include both solar-reflected and Earth-emitted radiation from the top of the atmosphere to the Earth’s surface. These measurements, called radiative fluxes, represent the amount of energy radiated through a given area within a given time range. CERES provides the only global top of atmosphere energy budget dataset. In addition, the CERES science team uses measurements from a high spatial resolution visible/infrared imager flying alongside CERES to infer a variety of cloud properties, including cloud amount, altitude, thickness, and the size of cloud particles. Data from CERES FM6 will help scientists further develop a quantitative understanding of the links between the Earth’s energy budget and the properties of atmosphere and surface that define it. This is related to the following mission(s): This publication appears in: |
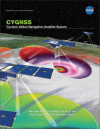 |
CYGNSS Mission Brochure This brochure provides an overview of NASA's Cyclone Global Navigation Satellite System (CYGNSS) mission--NASA’s first satellite mission to measure surface winds in the inner core of tropical cyclones, including regions beneath the eyewall and intense inner rainbands that could not previously be measured from space. These measurements will help scientists obtain a better understanding of what causes variations in tropical cyclone intensity, helping to improve our ability to forecast tropical cyclones such as Hurricane Katrina. This is related to the following mission(s): This publication appears in: |
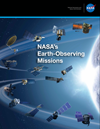 |
NASA's Earth-Observing Missions To study the Earth as a whole system and understand how it is changing, NASA develops and supports a large number of Earth-observing missions. This brochure provides an overview of NASA’s operating and future missions as of October 2015. This publication appears in: |
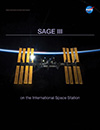 |
SAGE III on the International Space Station NASA’s Stratospheric Aerosol and Gas Experiment (SAGE) family of remote-sensing-satellite instruments has long measured ozone (O3) concentrations, stratospheric aerosols, water vapor, and other trace gases that influence Earth’s atmosphere. Planned for launch in 2016, SAGE III on the International Space Station will continue the legacy of accurate SAGE measurements. This brochure provides details about the instrument, launch and installation, ground system and data, and more! This publication appears in: |
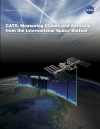 |
CATS: Measuring Clouds and Aerosols from the ISS In 2011 the International Space Station (ISS) NASA Research Office offered scientists at NASA’s Goddard Space Flight Center a mounting location onboard the space station for a new lidar instrument called the Clouds and Aerosol Transport System (CATS). Described in this brochure, CATS provides vertical profiles of cloud and aerosol properties at three wavelengths (1064, 532, and 355 nanometers). The CATS mission seeks to build on the CALIPSO data record, provide observational lidar data to improve research and operational modeling programs, and demonstrate new lidar retrievals of clouds and aerosols from space. These technologies and the science gained from the CATS mission will be used to design future missions that will study clouds and aerosols and their affects on Earth’s climate and air quality for years to come. This is related to the following mission(s): This publication appears in: |
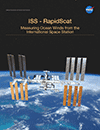 |
ISS-Rapid Scatterometer (2014) Described in this brochure, NASA’s International Space Station Rapid Scatterometer, or ISS-RapidScat, is the first scientific instrument specifically created to observe Earth winds from the space station. Scheduled for launch in late 2014, the experimental mission will measure ocean-surface wind speeds and directions, providing data that are needed to support weather and marine forecasting—including tracking storms and hurricanes—and climate research. The space station’s unique orbit will allow ISS-RapidScat to make the first direct observations of how ocean winds vary over the course of the day. This is related to the following mission(s): This publication appears in: |