- Home
- Missions
- Data
- Communications
- People
- The Earth Observer Newsletter

Recent Imagery
You will be directed to the NASA Visible Earth webpage when you select Images by Mission below, or click on the images at right that are randomly generated to represent four out of all possible topics.

You are here
Brochures
NASA's Earth Observing System provides a variety of materials available for download. Feel free to choose a category below:
- Brochures
- Postcards
- Posters
- Science Writers’ Guide
- Mission Brochures
- Fact Sheets
- Calendars
- Booklets
- Lithographs
- Reference and Data Products Handbooks
- iBooks
- Activities
 |
Orbiting Carbon Observatory 2 (2014) This brochure describes NASA's Orbiting Carbon Observatory 2 (OCO-2) mission. OCO-2 is the first NASA satellite dedicated to monitoring carbon dioxide, and it will do so with greater precision and detail than current instruments. Data from OCO-2 will help scientists understand where carbon dioxide is being emitted and removed from the atmosphere, subsequently allowing them to make projections of how Earth’s climate might respond to these changes in the future. This is related to the following mission(s): This publication appears in: |
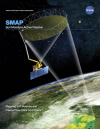 |
Soil Moisture Active Passive (2014) The Soil Moisture Active Passive, or SMAP, mission (described in this brochure) is NASA’s first Earth-observing satellite mission designed to collect continuous global observations of surface soil moisture and freeze/thaw state every 2-3 days at 3 to 40 kilometer (~2 to 25 mile) spatial resolution. As suggested by the name “Active Passive,” SMAP will carry an active microwave radar and a passive microwave radiometer that will measure across a 1000-kilometer (~621-mile) wide swath. The ability to measure global soil moisture and its freeze/thaw state from space with unprecedented accuracy and spatial resolution will allow scientists to better understand the processes that link the Earth’s water, energy, and carbon cycles, as well as enhance the predictive skills of weather and climate models. In addition, scientists can use these data to develop improved flood prediction and drought monitoring capabilities. Societal benefits include improved water-resource management, agricultural productivity, and wildfire and landslide predictions. This is related to the following mission(s): This publication appears in: |
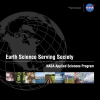 |
Earth Science Serving Society: NASA Applied Sciences Program (2012) The NASA Applied Sciences Program promotes and funds activities that discover and demonstrate innovative uses and practical benefits of NASA’s Earth science resources. By partnering with public and private organizations to apply NASA scientific findings and Earth observing data to decision-making activities, the Applied Sciences Program actively benefits society through Earth science. This publication appears in: |
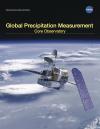 |
GPM Core Observatory (2014) The Global Precipitation Measurement (GPM) mission is an international partnership co-led by NASA and the Japan Aerospace Exploration Agency (JAXA). The mission centers on the deployment of the GPM Core Observatory and consists of a network, or constellation, of additional satellites that together will provide next-generation global observations of precipitation from space. In this brochure you will learn about the specifics of the GPM Core Observatory and its role in the GPM mission. This is related to the following mission(s): This publication appears in: |
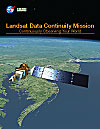 |
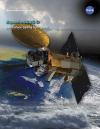
Landsat Data Continuity Mission Unprecedented changes in land cover and use are having profound consequences for weather and climate change, ecosystem function and services, carbon cycling and sequestration, resource management, the national and global economy, human health, and society. Measurements taken by the Landsat Data Continuity Mission (LDCM) serve NASA research in the focus areas of climate, carbon cycle, ecosystems, water cycle, biogeochemistry, and Earth surface/interior. This is related to the following mission(s): This publication appears in: |
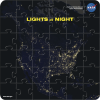 |
Lights at Night Puzzle The Lights at Night puzzle features a region of the North American continent at night centered on the contiguous United States as observed by the Visible Infrared Imaging Radiometer Suite (VIIRS) onboard the Suomi National Polar-orbiting Partnership (NPP) satellite. The image was created using data from the VIIRS "day-night band" from nine days in April and thirteen days in October 2012. The file includes a brochure with more information about how the image was made and how the VIIRS lights-at-night dataset is used, as well as several interesting facts and a lights-at-night map quiz. This is related to the following mission(s): This publication appears in: |
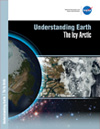 |
Understanding Earth: The Icy Arctic Over the last decade, satellite data—often combined with data from other sources—have revealed that the Arctic is changing at rates faster than anywhere else on Earth. These changes are interrelated and have both long- and short-term effects on Earth’s land surfaces, oceans, and atmosphere, ultimately impacting the Earth’s climate system. To better understand the Arctic environment, scientists at NASA are working in collaboration with various experts from other federal agencies, universities, private companies, and not-for-profit organizations. This booklet—the third in the Understanding Earth series—explains how NASA keeps a close eye on the Arctic and how the changes taking place there are affecting you. This publication appears in: |
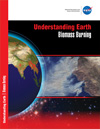 |
Understanding Earth: Biomass Burning When biomass is burned, copious amounts of gases and particulate matter are released, billowing smoke plumes can fill the sky, and entire ecosystems can change in seconds. Fortunately, NASA’s Earth-observing satellites are able to monitor these changes, critical for understanding the effects biomass burning has on Earth’s atmosphere and climate system. This booklet—second in the Understanding Earth series—explains the causes and effects of biomass burning. You’ll learn about the wildfires that burned across western Russia in 2010, the 2011 Wallow Fire in Arizona that burned for nearly 984 hours, NASA’s ARCTAS mission, and more. “Understanding Earth: Biomass Burning” offers a variety of images and shows how NASA satellites provide a unique vantage point to observe and study these events. This publication appears in: |
 |
Aquarius/SAC-D Changes in sea surface salinity have large-scale effects on Earth’s water cycle and ocean circulation. Before now, scientists had studied these changes using measurements collected by ships and buoys out at sea. Fortunately, for the first time ever, NASA’s Aquarius/SAC-D satellite will provide space-based, global sea surface salinity measurements. Surface salinity data from Aquarius/SAC-D will give scientist a key to better understanding how ocean circulation is tied to global climate. This is related to the following mission(s): This publication appears in: |
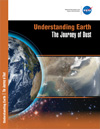 |
Understanding Earth: The Journey of Dust In April 2001, the “Perfect Dust Storm” struck when wind whipped dust from deserts in Mongolia and China over Eastern Asia and the Pacific Ocean. Sensors aboard NASA Earth observing satellites tracked the movement and density of the aerosols as the cloud traveled eastward for more than two weeks. The booklet, “Understanding Earth: The Journey of Dust,” explains the causes of the 2001 storm, the effects of dust storms on society and climate, and possible ways to minimize their frequency. With satellite imagery, “The Journey of Dust” shows how NASA satellites provide a unique vantage point to observe and study these large-scale events. This publication appears in: |