- Home
- Missions
- Data
- Communications
- People
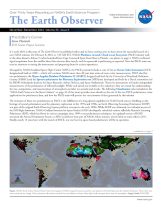
- The Earth Observer Newsletter
Recent Imagery
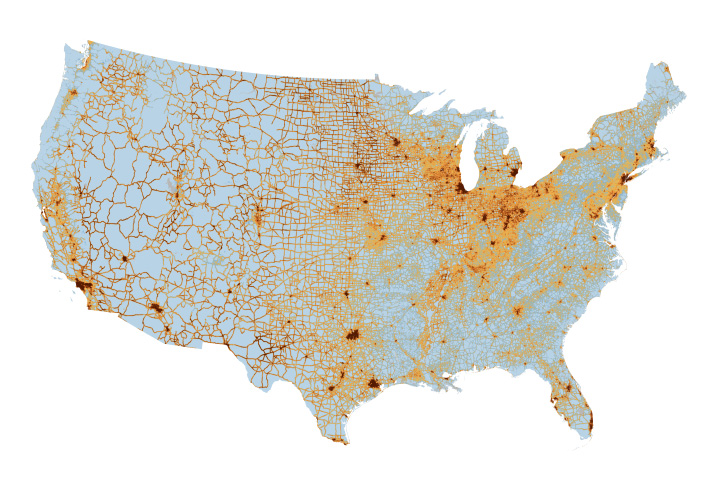
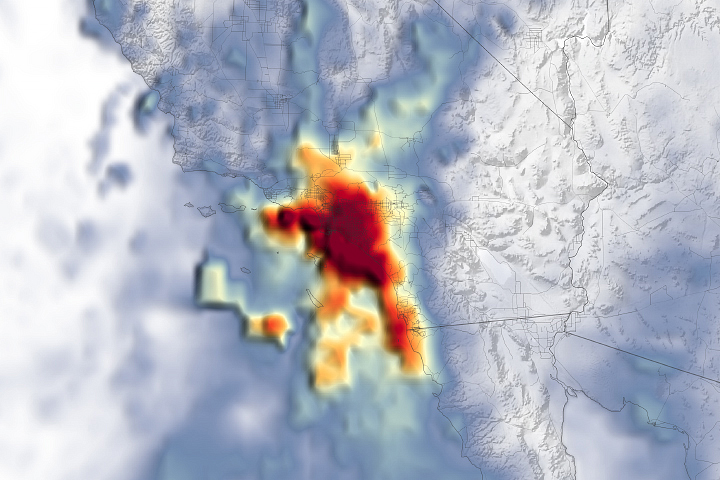
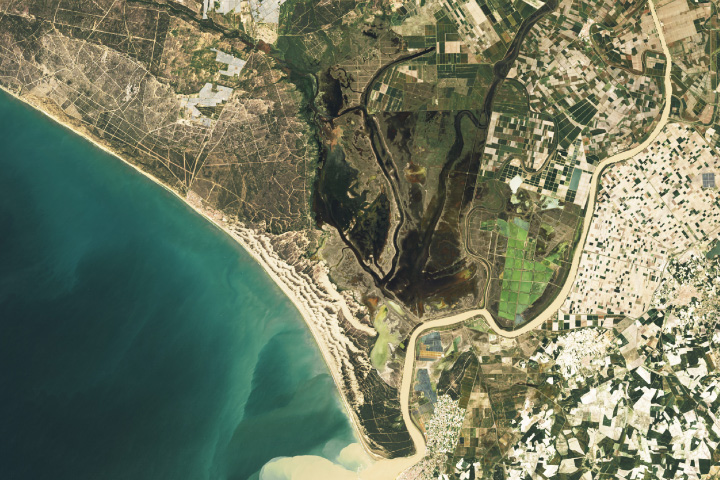
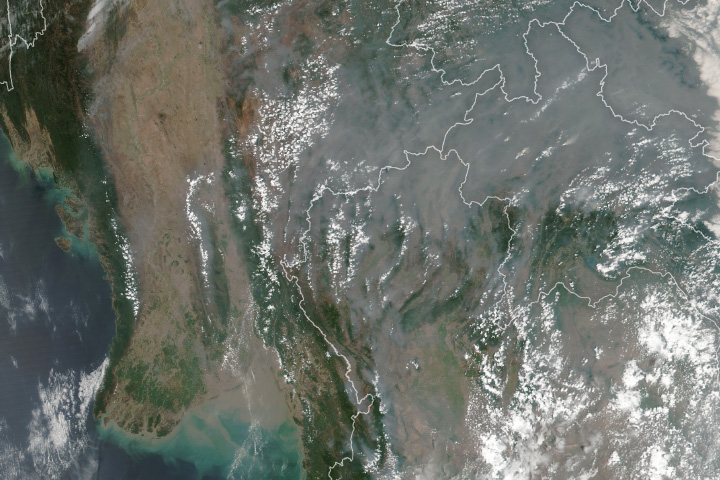
You will be directed to the NASA Visible Earth webpage when you select Images by Mission below, or click on the images at right that are randomly generated to represent four out of all possible topics.
You are here
Science Communication Material
NASA's Earth Observing System provides a variety of materials available for download. Feel free to choose a category below:
- Brochures
- Postcards
- Posters
- Science Writers’ Guide
- Mission Brochures
- Fact Sheets
- Calendars
- Booklets
- Lithographs
- Reference and Data Products Handbooks
- iBooks
- Activities
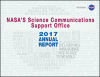 |
NASA's Science Communication Support Office Annual Report 2017 The Science Communications Support Office (SCSO) supported 18 domestic and international science conferences and 6 public events in 2017. The SCSO continues to provide an inspiring and interactive venue for every event during the year, using a unique storytelling approach that allows a variety of audiences worldwide to connect with NASA Science. The 2017 Annual Report provides an overview of these activities with details about new Hyperwall stories, publications, social media, key partnerships, and more! This publication appears in: |
 |
2017 AGU Schedule of Events at the NASA Booth During the 2017 AGU Fall Meeting, held December 11-15, 2017, navigate the streets (or rues) of the NASA Booth (#1645) and immerse yourself in science. Join us at the Inspiration Theatre for science stories, share a piece of your personal history involving NASA at NASA’s Living Timeline exhibit, and make new science connections while strolling down Avenues Interconnected, Impact, Innovation, and Inspiration. Learn something new, have fun, and discover together! This publication appears in: |
 |
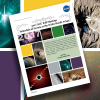
2017 NASA Science Mission Directorate Calendar |
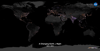 |
A Changing Earth at Night The map on the front of this poster shows the change in lighting intensity from 2012 to 2016. The map was created using two separate night lights datasets (from 2012 and 2016) derived using data from the Visible Infrared Imaging Radiometer Suite (VIIRS) on the National Oceanic and Atmospheric Administration (NOAA)-NASA Suomi National Polar-orbiting Partnership (NPP) satellite. The back of the poster explains how scientists use night lights data from VIIRS to study our planet at night. This is related to the following mission(s): This publication appears in: |
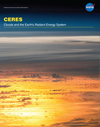 |
CERES FM6 The Clouds and the Earth’s Radiant Energy System, or CERES, instrument measures reflected sunlight and thermal radiation emitted by the Earth. Data products from CERES include both solar-reflected and Earth-emitted radiation from the top of the atmosphere to the Earth’s surface. These measurements, called radiative fluxes, represent the amount of energy radiated through a given area within a given time range. CERES provides the only global top of atmosphere energy budget dataset. In addition, the CERES science team uses measurements from a high spatial resolution visible/infrared imager flying alongside CERES to infer a variety of cloud properties, including cloud amount, altitude, thickness, and the size of cloud particles. Data from CERES FM6 will help scientists further develop a quantitative understanding of the links between the Earth’s energy budget and the properties of atmosphere and surface that define it. This is related to the following mission(s): This publication appears in: |
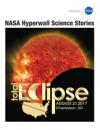 |
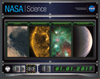
Eclipse Hyperwall Science Stories On Monday, August 21, 2017, all of North America will be treated to an eclipse of the sun. Anyone within the path of totality can see one of nature’s most awe inspiring sights—a total solar eclipse. This path, where the moon will completely cover the sun and the sun’s tenuous atmosphere—the corona—can be seen, will stretch from Salem, Oregon to Charleston, South Carolina. Observers outside this path will still see a partial solar eclipse where the moon covers part of the sun’s disk. This brochure contains high-definition visualizations related to the eclipse, past eclipses and transits, and our sun. This publication appears in: |
 |
NASA Earth Observations: Quick Tools Quick tools to explore Earth science concepts. This publication appears in: |
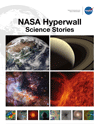 |
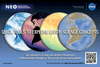
NASA Hyperwall Science Stories This brochure represents some of the science stories available on NASA’s Hyperwall. This publication appears in: |
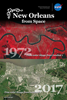 |
New Orleans from Space Postcard of New Orleans, LA. The top image is a 1972 false color Landsat 1 scene of New Orleans, LA that uses green, red, and infrared wavelengths to highlight vegetation in red. Advances in space imaging over the past four and a half decades allow sensors to record more wavelengths. Today, true color Landsat 8 scenes, such as the one shown in the bottom image, look like photographs from space. This is related to the following mission(s): This publication appears in: |
 |
Seadler - GRIP Results One-Pager NASA’s Genesis and Rapid Intensification Processes (GRIP) experiment studied the physical and environmental factors that contribute to hurricane formation and intensification. The experiment sought to answer 1) What environmental and inner-core processes determine whether a storm will strengthen into a hurricane? And 2) To what extent can we predict whether this intensification will occur? From 15 August through 30 September 2010, NASA flew three aircraft carrying fifteen instruments over the Atlantic Ocean and Gulf of Mexico to measure vertical and horizontal wind speeds, precipitation, pressure, temperature, and humidity in and around tropical cyclones in an attempt to figure out what fuels the powerful storms. This publication appears in: |