- Home
- Missions
- Data
- Communications
- People
- The Earth Observer Newsletter
Recent Imagery
You will be directed to the NASA Visible Earth webpage when you select Images by Mission below, or click on the images at right that are randomly generated to represent four out of all possible topics.

You are here
Postcards
NASA's Earth Observing System provides a variety of materials available for download. Feel free to choose a category below:
- Brochures
- Postcards
- Posters
- Science Writers’ Guide
- Mission Brochures
- Fact Sheets
- Calendars
- Booklets
- Lithographs
- Reference and Data Products Handbooks
- iBooks
- Activities
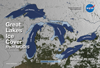 |
Great Lakes Ice Cover from MODIS This lenticular card shows the daily percentage of the lake area covered by ice as derived using data from NASA’s Moderate Resolution Imaging Spectroradiometer (MODIS) on December 25, 2013, and January 25, February 25, and March 25, 2014. The maximum ice extent occurred on March 6 when 92.5% of the surface of the Great Lakes was covered with ice. This is the second most extensive ice cover observed over the lakes since the satellite record began in 1973. This publication appears in: |
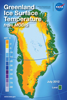 |
Greenland Ice Surface Temperature from MODIS This lenticular card flips between monthly-average ice surface temperature (IST) of the Greenland ice sheet for July 2012 and July 2013, derived using data from NASA’s Moderate Resolution Imaging Spectroradiometer (MODIS) instruments onboard the Terra and Aqua satellites. In July 2012 approximately 99% of the top layer of the ice sheet melted for a short period of time—the greatest areal extent of surface melting in over 125 years. This publication appears in: |
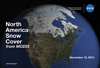 |
North America Snow Cover from MODIS The images on the front show the extent of North America covered by snow on November 13, 2013, and February 13 and April 13, 2014, as derived using data from NASA’s Moderate Resolution Imaging Spectroradiometer (MODIS) instruments onboard the Terra and Aqua satellites. Snow cover extent peaked in February when approximately 67% of the contiguous United States was covered with snow—282,000 square miles (~730, 400 square kilometers) (roughly the size of Texas) above the 1981-2010 average. This publication appears in: |
|
|
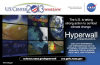
Hyperwall Stories Lenticular Card This lenticular card flips between popular images from NASA's Hyperwall shows. Hyperwall stories are available for download as PowerPoint and Keynote Files at svs.gsfc.nasa.gov/hw. This publication appears in: |
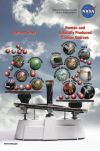 |
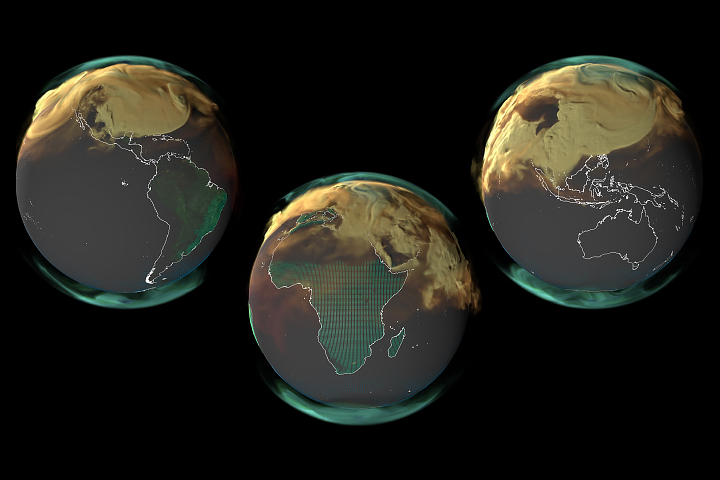
Observing Carbon Dioxide in the Earth System This lenticular card illustrates that while natural and anthropogenic (i.e., human- induced) carbon sources and sinks can be found almost anywhere in the world, human activities are causing the sources of carbon to outweigh the sinks. The back of the card explains that NASA's Orbiting Carbon Observatory-2 (OCO-2) mission is the first NASA satellite dedicated to monitoring carbon dioxide, and it will do so with greater precision and detail than current instruments. This is related to the following mission(s): This publication appears in: |
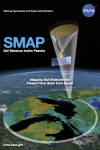 |
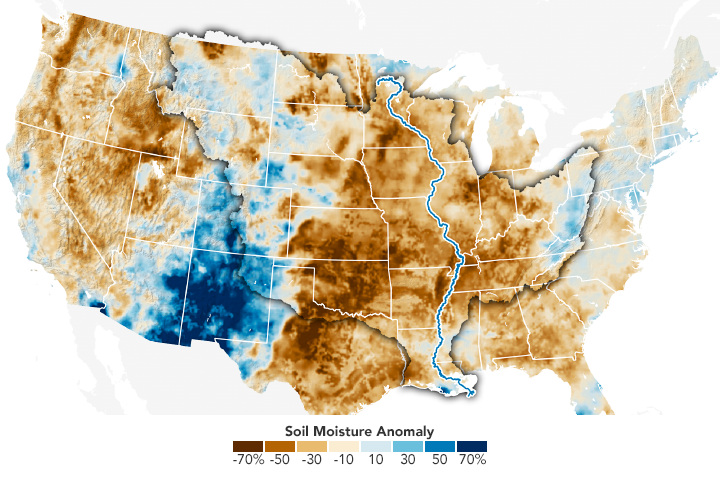
Soil Moisture Active Passive, Lenticular (2014) NASA’s Soil Moisture Active Passive (SMAP) mission (described on this lenticular product), scheduled to launch in late 2014, is designed to collect continuous global observations of surface soil moisture and freeze/thaw state every 2-3 days at 3 to 40 kilometer spatial resolution. SMAP will carry an active microwave radar and a passive microwave radiometer that will measure across a 1000-kilometer wide swath. These measurements will allow scientists to better understand the processes that link the Earth’s water, energy, and carbon cycles, as well as enhance the predictive skills of weather and climate models. Scientists can also use SMAP data to develop improved flood prediction and drought monitoring capabilities. This is related to the following mission(s): This publication appears in: |
|
|
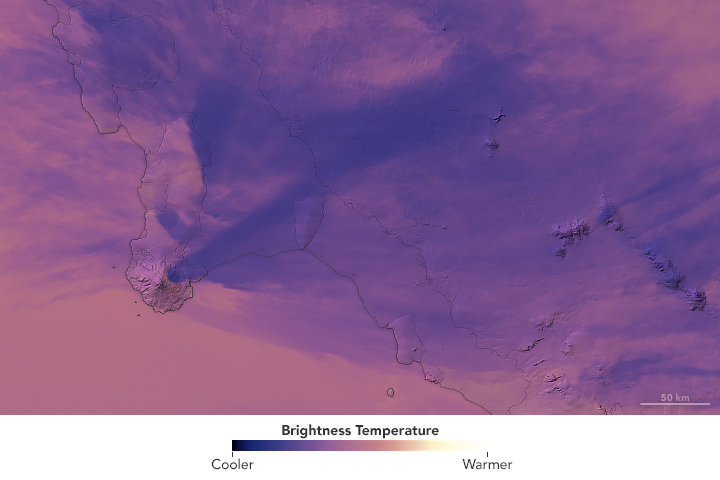
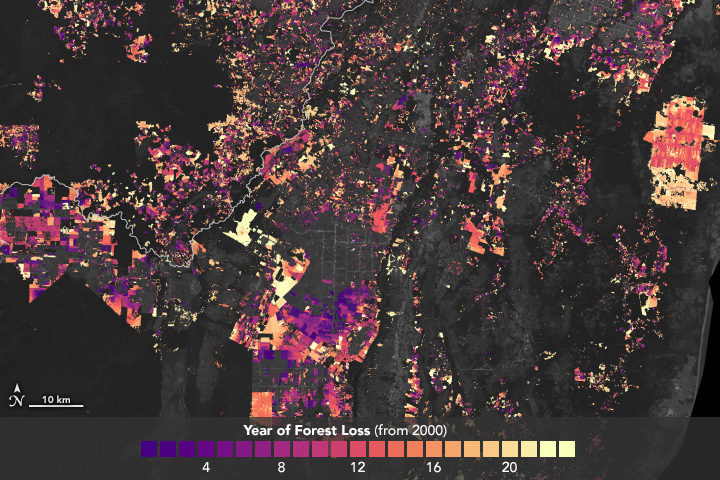
World Parks Lenticular Card This lenticular card shows environmental changes inside four National Parks around the world. This publication appears in: |
 |
COP-19 Hyperwall Presentation Schedule This postcard provides the titles, speaker names, and times of the daily NASA hyperwall presentation schedule during the nineteenth session of the Conference of the Parties (COP-19), held November 11-22, 2013, in Warsaw, Poland. This publication appears in: |
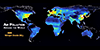 |
Air Pollution Around the World, 2005-2010 An at-a-glance tour of the world's nitrogen dioxide (NO2) pollution during the years 2005 and 2010. Discover how population correlates with this important pollutant and where its concentration has changed over time. This publication appears in: |
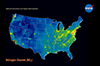 |
Assessing Air Quality from Space Learn about the direct connection between population density in the United States and air pollution in this striking comparison between 3 maps: the 2010 census, U.S. city lights at night, and nitrogen dioxide concentration. This publication appears in: |