- Home
- Missions
- Data
- Communications
- People
- The Earth Observer Newsletter
Recent Imagery
You will be directed to the NASA Visible Earth webpage when you select Images by Mission below, or click on the images at right that are randomly generated to represent four out of all possible topics.

You are here
Lithographs
NASA's Earth Observing System provides a variety of materials available for download. Feel free to choose a category below:
- Brochures
- Postcards
- Posters
- Science Writers’ Guide
- Mission Brochures
- Fact Sheets
- Calendars
- Booklets
- Lithographs
- Reference and Data Products Handbooks
- iBooks
- Activities
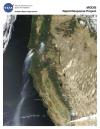 |
MODIS-Rapid Response In mid-July 2002, lightning started a fire in the Klamath Mountains in southwestern Oregon that eventually burned over the state line into California and consumed more than 400,000 acres by late August. The Biscuit fire became one of the largest in the state’s history, threatening not only human life and property, but also three nationally designated wild and scenic rivers and habitat for several species of plants and animals already at risk of extinction. Firefighters also had their hands full with other fires across the state, including the Tiller Complex Fire to the northeast. This publication appears in: |
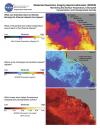 |
MODIS Monitoring Sea Surface Temperature, Chlorophyll Concentration, and Phytosynthetic Activity A sensor orbiting the Earth aboard NASA’s Terra and Aqua satellites is now collecting the most detailed measurements ever made of the ocean’s surface environment. Like a sophisticated thermometer in space, the Moderate Resolution Imaging Spectroradiometer (MODIS) can measure sea surface temperature every day over the entire globe. This publication appears in: |
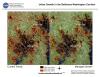 |
Urban Growth These images show the extent of land developed as urban, commercial and residential areas between 1986 and 2000, and projected development to 2030 in the Baltimore-Washington D.C. Metropolitan area. Past and current urban extent were derived using Landsat Thematic Mapper (TM) and Enhanced Thematic Mapper Plus (ETM+) satellite images. This publication appears in: |
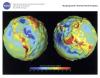 |
GRACE This lithograph displays the most accurate map to date of Earth’s long wavelength gravity field and is the first version to be released by NASA’s Gravity Recovery and Climate Experiment (GRACE) mission. We call these maps gravity anomaly maps because they show us how much Earth’s actual gravity field departs from "normal," as defined by a simplified mathematical gravity model that assumes the Earth is perfectly smooth and featureless. The maps reveal that the Earth is a restless, dynamic planet, both at its surface and deep within its interior. This is related to the following mission(s): This publication appears in: |
 |
MOPITT MOPITT is an infrared gas correlation radiometer that is making the first long-term global observations of carbon monoxide and methane as Terra circles the Earth from pole to pole, 14.4 times every day. From these measurements the sources, motions and sinks of CO can be determined. This publication appears in: |
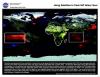 |
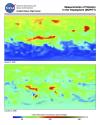
Using Satellites to Track Rift Valley Fever Rift Valley Fever (RVF), at least in the African country of Kenya, has been well known for over 60 years. As early as 1913, a disease fitting the description of RVF was blamed for the loss of sheep in the Rift Valley in kenya. However, it was not until scientists studied an outbreak of the disease in 1931 that a virus was isolated and shown to cause the disease. By using satellites to closely monitor the vegetation in the region affected by increased rainfall, scientists can identify likely habitats for the mosquitoes that carry the RVF virus, and provide advance warning of large-scale outbreaks of the disease. This publication appears in: |
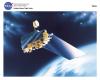 |
Terra NASA’s commitment to studying the Earth as a global system continued with the launch of the Terra spacecraft in December 1999 representing a key contribution by NASA to the U.S. Global Change Research Program. Terra was the first of several EOS spacecraft that are observing the Earth’s continents, oceans and atmosphere. It has five state-of-the-art instruments achieving measurement capability and accuracy never known before. This is related to the following mission(s): This publication appears in: |
 |
1997-98 El Nino (1998) This image shows the progression of the 1997-98 El Niño as derived rom the TOPEX/Poseidon satellite. This publication appears in: |
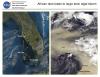 |
African Dust Leads to Large Toxic Algal Bloom (2001) Each year, several hundred million tons of African dust are transported westward over the Atlantic to the Caribbean, Gulf of Mexico, Central America, and South America. Thunderstorms and accompanying warm air can lift dust as high as 4575 meters (15,000 feet) above the African deserts, and then out across the Atlantic. This publication appears in: |
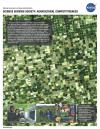 |
Agricultural Competitiveness (2003) One of our nations most vital needs is a stable and dependable food supply for an ever-increasing population. The Midwest United States is known as America’s Breadbasket because it is home to the vast majority of America’s productive farmland and is a vital cog in the American economy. Any disruption to the productivity of these lands can have devastating economic consequences. For example, in the summer of 1988, the Midwest United States experienced its worst dry spell since the 1930s causing an estimated $40 billion in crop damages. In contrast, summer 1993 was exceptionally wet, with flooding on the Missouri and Mississippi rivers that wreaked havoc on agricultural lands and caused extensive crop damage. This publication appears in: |