- Home
- Missions
- Data
- Communications
- People
- The Earth Observer Newsletter
Recent Imagery
You will be directed to the NASA Visible Earth webpage when you select Images by Mission below, or click on the images at right that are randomly generated to represent four out of all possible topics.

You are here
Lithographs
NASA's Earth Observing System provides a variety of materials available for download. Feel free to choose a category below:
- Brochures
- Postcards
- Posters
- Science Writers’ Guide
- Mission Brochures
- Fact Sheets
- Calendars
- Booklets
- Lithographs
- Reference and Data Products Handbooks
- iBooks
- Activities
 |
Air Quality (2003) The Clean Air Act, created in 1972 and last amended in 1990, responds to the basic societal need for clean, breathable air and recognizes the need to protect this vital natural resource. Congress directed the Environmental Protection Agency (EPA) to set National Ambient Air Quality Standards (NAAQS) for pollutants considered harmful to public health and the environment. Although these regulations have significantly improved the quality of our nation’s air over the past 30 years, people in some areas are still exposed to air pollution levels that exceed the NAAQS. Numerous studies have shown significant effects of air pollution on human health, agriculture, ecosystems, and physical infrastructure. This publication appears in: |
 |
Aqua (2001) The Aqua mission, launched in May 2002, builds on NASA’s long history of studying the Earth and its atmosphere from the impressive perspective of space. Amongst the aims are an integrated understanding of the Earth system at present, an improved understanding of the prominent changes the system has undergone in the past, and improved predictions regarding how the system is likely to change in the future. This is related to the following mission(s): This publication appears in: |
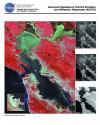 |
ASTER (2001) The ASTER instrument measures cloud properties, vegetation index, surface mineralogy, soil properties, surface temperature, and surface topography for selected regions of the Earth. This is related to the following mission(s): This publication appears in: |
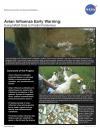 |
Avian Influenza Early Warning: Using NASA Data to Predict Pandemics (2010) Avian Influenza (AI) is an infection caused by avian influenza viruses. This lithograph explains how NASA data, models, and analysis techniques are used to enhance the decision capabilities concerning (AI) and pandemic influenza risks. This publication appears in: |
 |
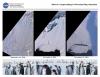
Aviation (2006) To compete in the global economy of the 21st Century, the United States requires a safe and efficient aviation infrastructure. Developing this infrastructure will require improvements to the safety, security, and capacity of the National Airspace System (NAS), as well as reductions in the environmental effects of aviation—such as noise and air pollution. Likewise, research has shown that the impact of the environment upon aviation—such as severe weather and other natural phenomena—could be substantially mitigated if existing satellite observations could be more fully utilized. This publication appears in: |
 |
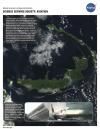
Birth of a New Iceberg in Pine Island Bay, Antarctica (2001) This lithograph shows the break-off of a large tabular iceberg from the Pine Island Glacier in West Antarctica. This event occurred between November 4th and 12th, 2001, and provides powerful evidence of rapid changes underway in this area of Antarctica. The three images were acquired by the vertical-viewing (nadir) camera of the Multi-angle Imaging SpectroRadiometer (MISR) instrument aboard NASA’s Terra spacecraft. The dimensions of the iceberg are approximately 42 kilometers by 17 kilometers (26 miles by 11 miles). This publication appears in: |
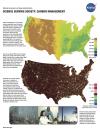 |
Carbon Management (2005) Carbon Dioxide (CO2) is fundamental for life on Earth. Human beings exhale CO2 as a waste product when they breathe, but plants absorb it in the life-sustaining process of photosynthesis—which human beings depend for the food we eat. CO2 is also a naturally occurring greenhouse gas (not the most efficient such gas but certainly the most abundant); its presence in the atmosphere moderates Earth’s average surface temperature and keeps nighttime temperatures from plunging to extreme cold. This publication appears in: |
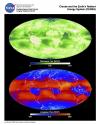 |
CERES (2001) CERES measures the balance of solar energy received by the Earth and the energy reflected and emitted back into space. Understanding the energy coming into and going out of the Earth system is critical for assessing whether scientists’ models of global climate change are making accurate predictions. This pair of images is the Terra mission’s first in an ongoing series of such measurements of our planet’s changing climate system. This publication appears in: |
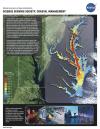 |
Coastal Management (2003) Our Earth’s coastal regions are a precious natural resource. The United States has over 95,000 miles of shoreline that provide resources for humans; homes for birds, animals and vegetation; and serves as vital ecosystems for many marine species. These shorelines are under siege from a number of natural phenomena. Global warming threatens to raise the level of the oceans and inundate our coastal lands. Harmful algal blooms (HAB), sometimes referred to as Red Tide, are caused by explosive growth of certain rare toxic species of algae, in response to excess nutrients in the water. These algae form the base of the food chain, and thus threaten fish, shellfish, birds, marine mammals, and even humans. The incidence of HAB outbreaks has increased significantly in recent years. Hypoxia refers to low dissolved oxygen concentrations on the ocean bottom that occur when excess nutrients in the water lead to elevated algae concentrations that deprive the plants and animals that dwell in deeper waters of vital life-giving oxygen. Over 7000 square miles of the Gulf of Mexico are hypoxic—the largest swath in the Western Hemisphere. The health of our shores has a major impact on our nations socioeconomic well being, as more than half of our population live in counties that border the sea. This publication appears in: |
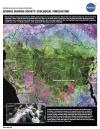 |
Ecological Forecasting (2005) Ecological forecasting involves the use of Earth observations and models to predict the impacts of environmental changes on the ecosystems upon which we depend for our very existence. It links the physical world of climate and geology to the living world of biology and ecology. Our goal is reliable forecast models of changes in living systems with uncertainties and estimates of error explicitly stated. These models must span spatial scales from molecular to global, as well as take advantage of information across time scales to test and refine the accuracy of our predictions. NASA is currently involved in several international and domestic partnerships under the theme of ecological forecasting. This publication appears in: |