- Home
- Missions
- Data
- Communications
- People
- The Earth Observer Newsletter
Recent Imagery
You will be directed to the NASA Visible Earth webpage when you select Images by Mission below, or click on the images at right that are randomly generated to represent four out of all possible topics.

You are here
Science Communication Material
NASA's Earth Observing System provides a variety of materials available for download. Feel free to choose a category below:
- Brochures
- Postcards
- Posters
- Science Writers’ Guide
- Mission Brochures
- Fact Sheets
- Calendars
- Booklets
- Lithographs
- Reference and Data Products Handbooks
- iBooks
- Activities
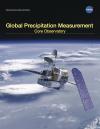 |
GPM Core Observatory (2014) The Global Precipitation Measurement (GPM) mission is an international partnership co-led by NASA and the Japan Aerospace Exploration Agency (JAXA). The mission centers on the deployment of the GPM Core Observatory and consists of a network, or constellation, of additional satellites that together will provide next-generation global observations of precipitation from space. In this brochure you will learn about the specifics of the GPM Core Observatory and its role in the GPM mission. This is related to the following mission(s): This publication appears in: |
 |
Hyperwall Design Template (Keynote) A fairly easy way to design your hyperwall layout(s) is to download this Keynote design template, mentioned in NASA’s Hyperwall: A Guide for Preparing Hyperwall Content. This template has been set up to display a grid that represents the individual videos screens using a 16 by 9 page size. This publication appears in: |
 |
Hyperwall Design Template (PowerPoint) A fairly easy way to design your hyperwall layout(s) is to download this PowerPoint design template, mentioned in NASA’s Hyperwall: A Guide for Preparing Hyperwall Content. This template has been set up to display a grid that represents the individual videos screens using a 16 by 9 page size. This publication appears in: |
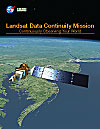 |
Landsat Data Continuity Mission Unprecedented changes in land cover and use are having profound consequences for weather and climate change, ecosystem function and services, carbon cycling and sequestration, resource management, the national and global economy, human health, and society. Measurements taken by the Landsat Data Continuity Mission (LDCM) serve NASA research in the focus areas of climate, carbon cycle, ecosystems, water cycle, biogeochemistry, and Earth surface/interior. This is related to the following mission(s): This publication appears in: |
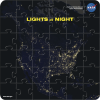 |
Lights at Night Puzzle The Lights at Night puzzle features a region of the North American continent at night centered on the contiguous United States as observed by the Visible Infrared Imaging Radiometer Suite (VIIRS) onboard the Suomi National Polar-orbiting Partnership (NPP) satellite. The image was created using data from the VIIRS "day-night band" from nine days in April and thirteen days in October 2012. The file includes a brochure with more information about how the image was made and how the VIIRS lights-at-night dataset is used, as well as several interesting facts and a lights-at-night map quiz. This is related to the following mission(s): This publication appears in: |
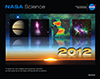 |
2012 NASA Science Mission Directorate Calendar |
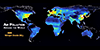 |
Air Pollution Around the World, 2005-2010 An at-a-glance tour of the world's nitrogen dioxide (NO2) pollution during the years 2005 and 2010. Discover how population correlates with this important pollutant and where its concentration has changed over time. This publication appears in: |
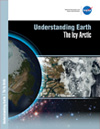 |
Understanding Earth: The Icy Arctic Over the last decade, satellite data—often combined with data from other sources—have revealed that the Arctic is changing at rates faster than anywhere else on Earth. These changes are interrelated and have both long- and short-term effects on Earth’s land surfaces, oceans, and atmosphere, ultimately impacting the Earth’s climate system. To better understand the Arctic environment, scientists at NASA are working in collaboration with various experts from other federal agencies, universities, private companies, and not-for-profit organizations. This booklet—the third in the Understanding Earth series—explains how NASA keeps a close eye on the Arctic and how the changes taking place there are affecting you. This publication appears in: |
 |
2011 NASA Science Mission Directorate |
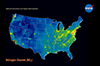 |
Assessing Air Quality from Space Learn about the direct connection between population density in the United States and air pollution in this striking comparison between 3 maps: the 2010 census, U.S. city lights at night, and nitrogen dioxide concentration. This publication appears in: |